ASHRAE HVAC Psychrometric Chart Mobile App for iOS
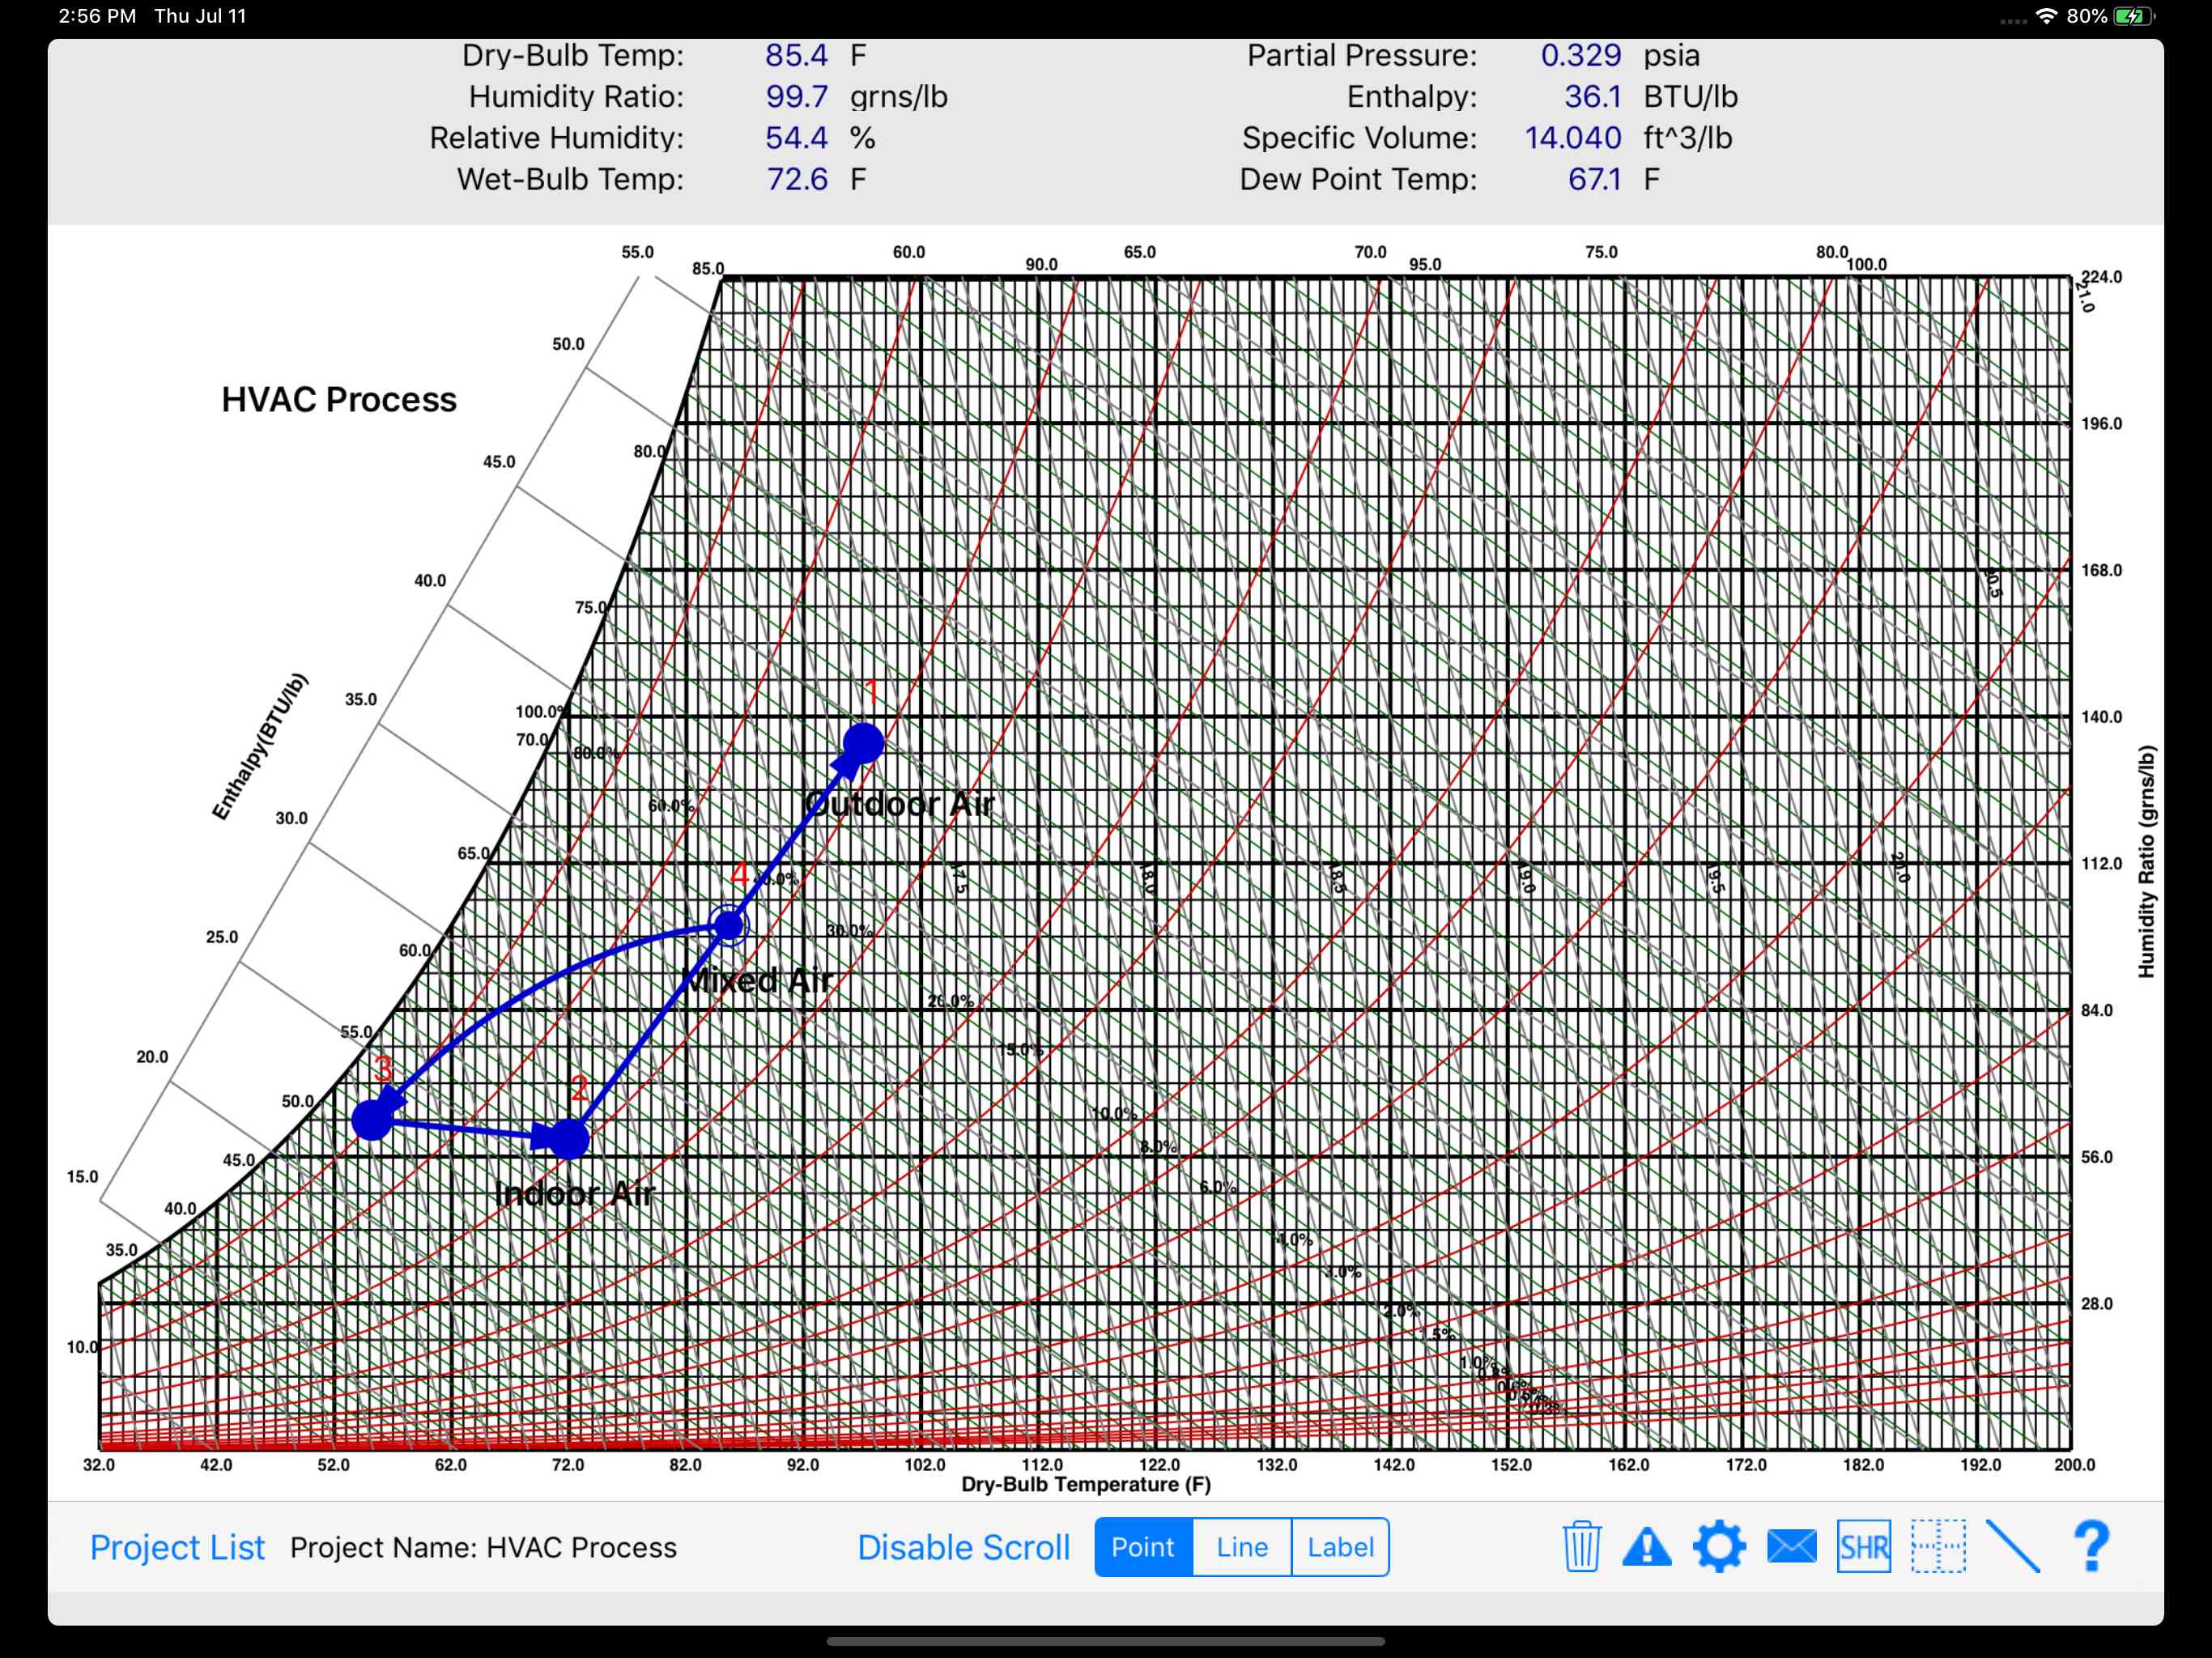
The HVAC Psychrometric Chart (HVAC Psych Chart) app was developed for ASHRAE. It is the first truly interactive graphical psychrometric chart for the iPad, and it includes both IP and SI units.
Using your finger, you can easily plot HVAC and other psychrometric processes on the iPad screen while you are out in the field, save the graphs, and then email the graph and results to yourself or clients.
Summary of Features
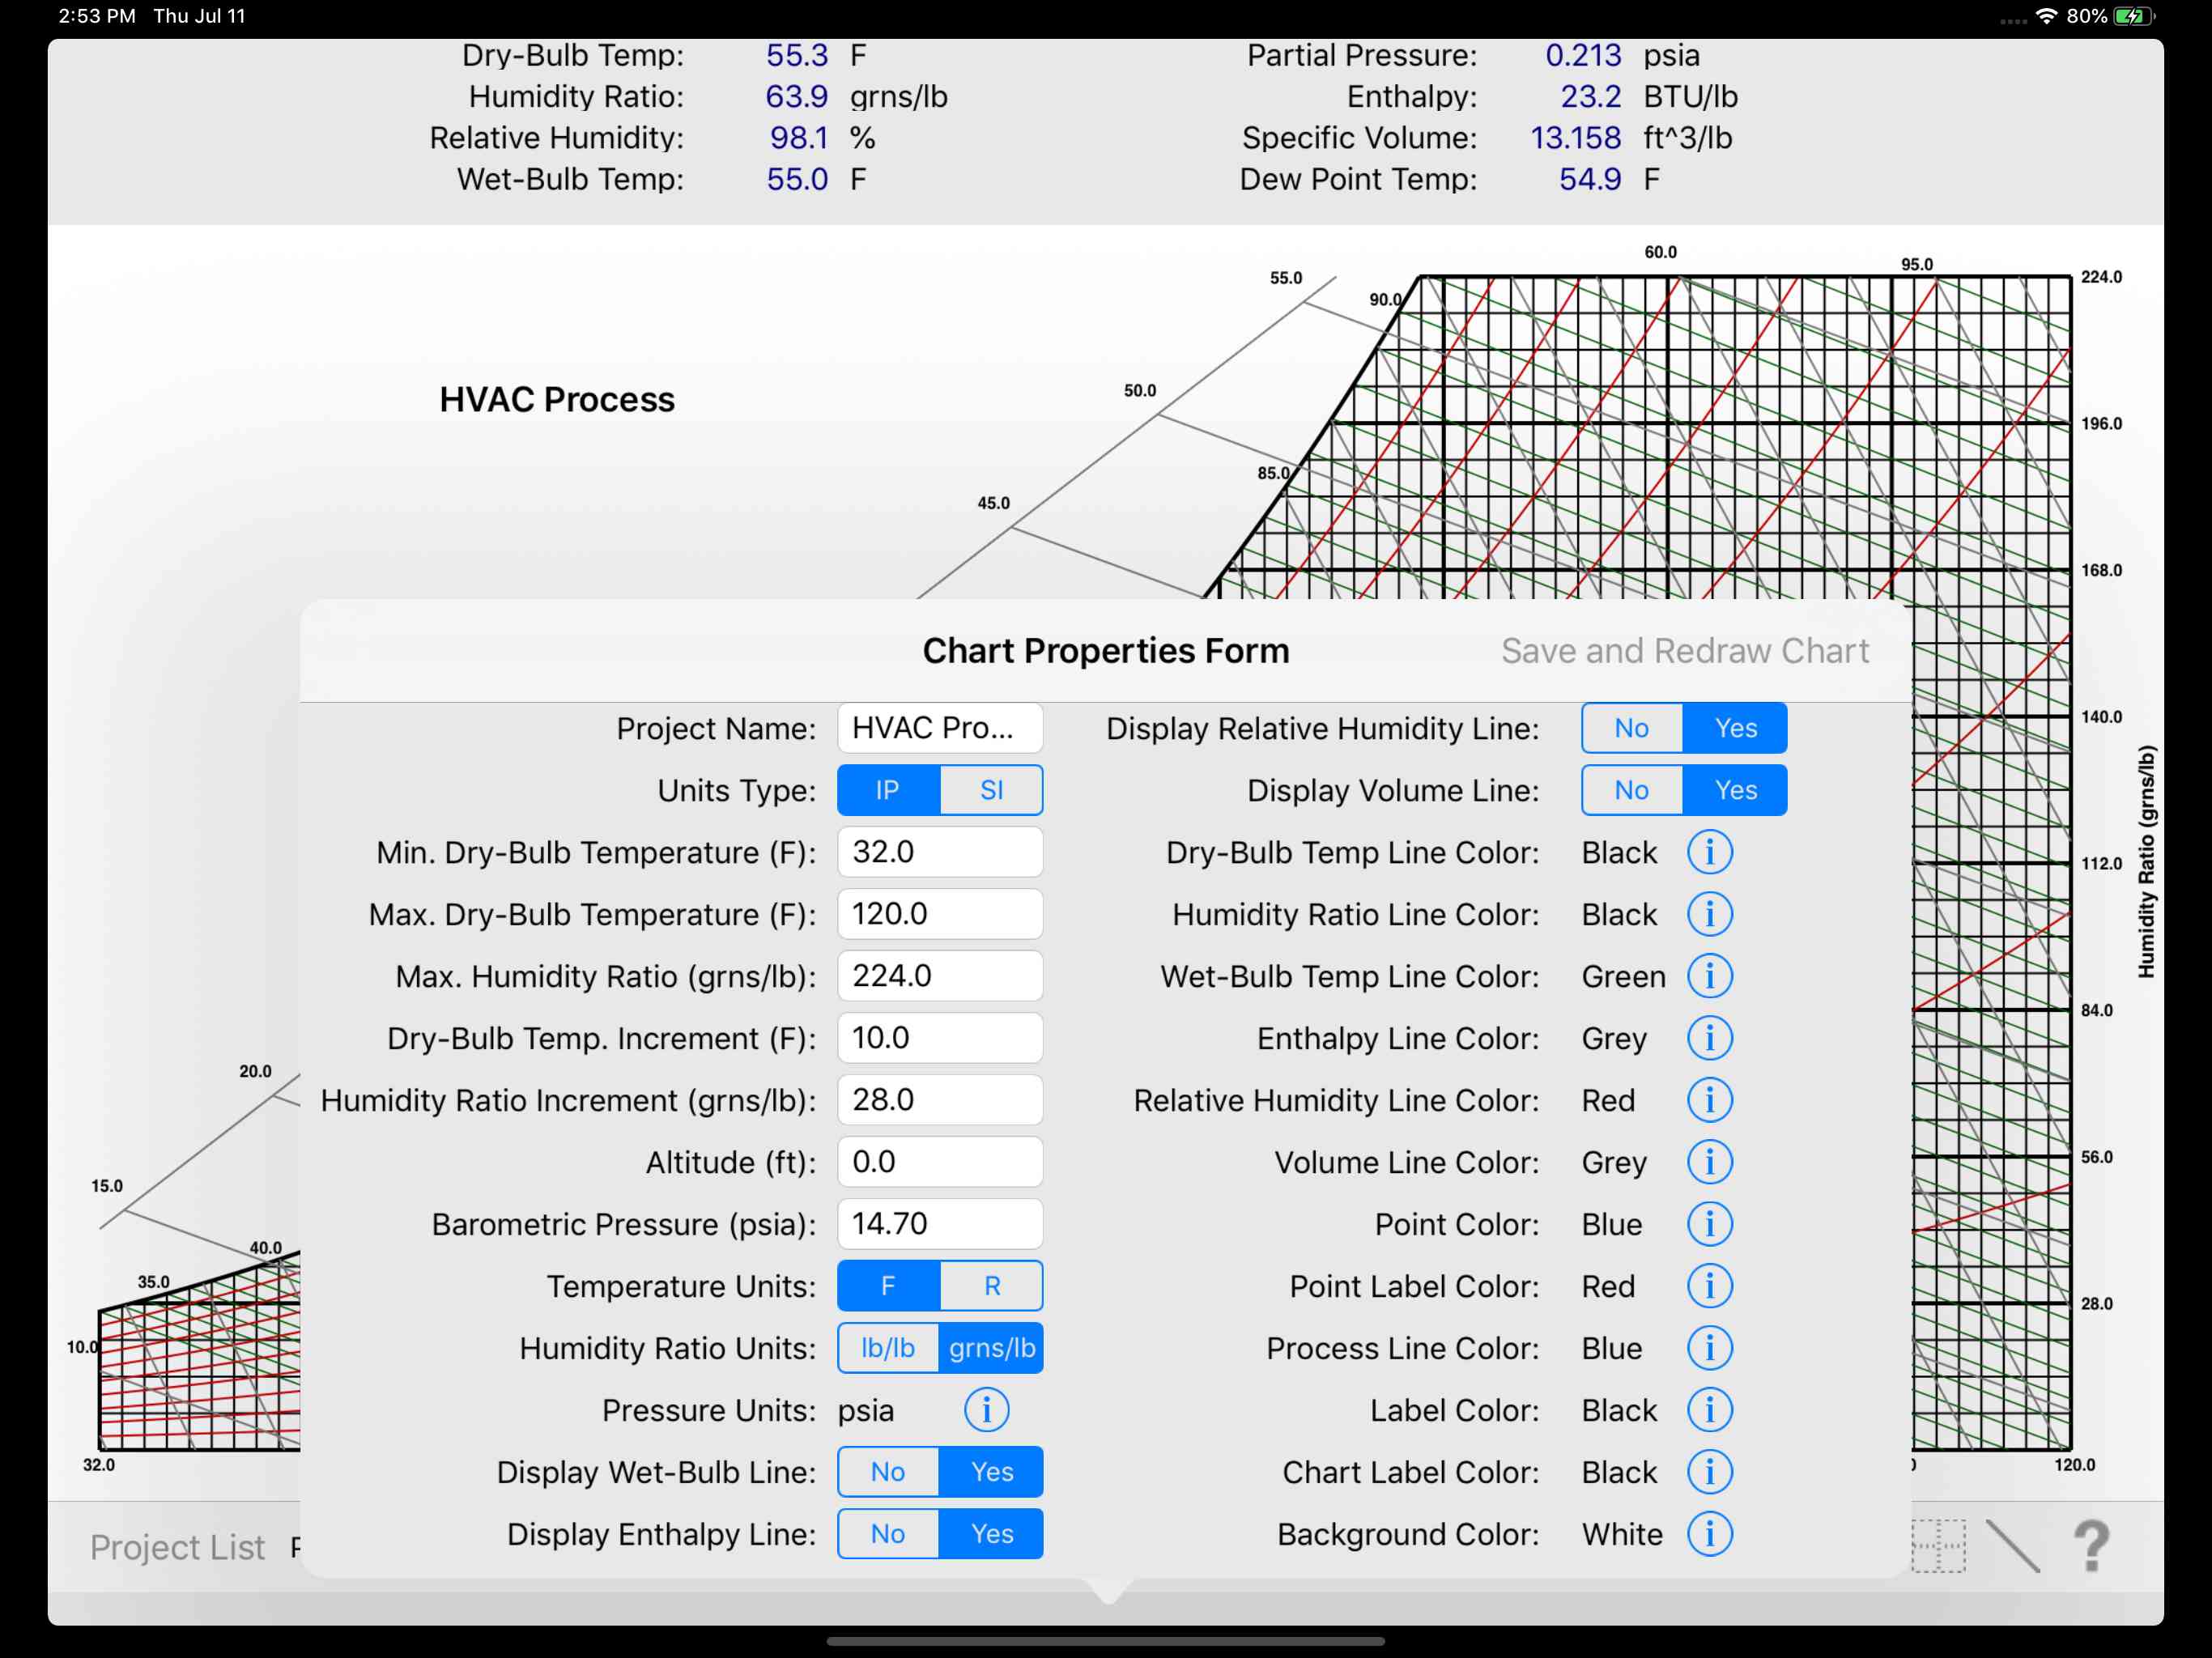
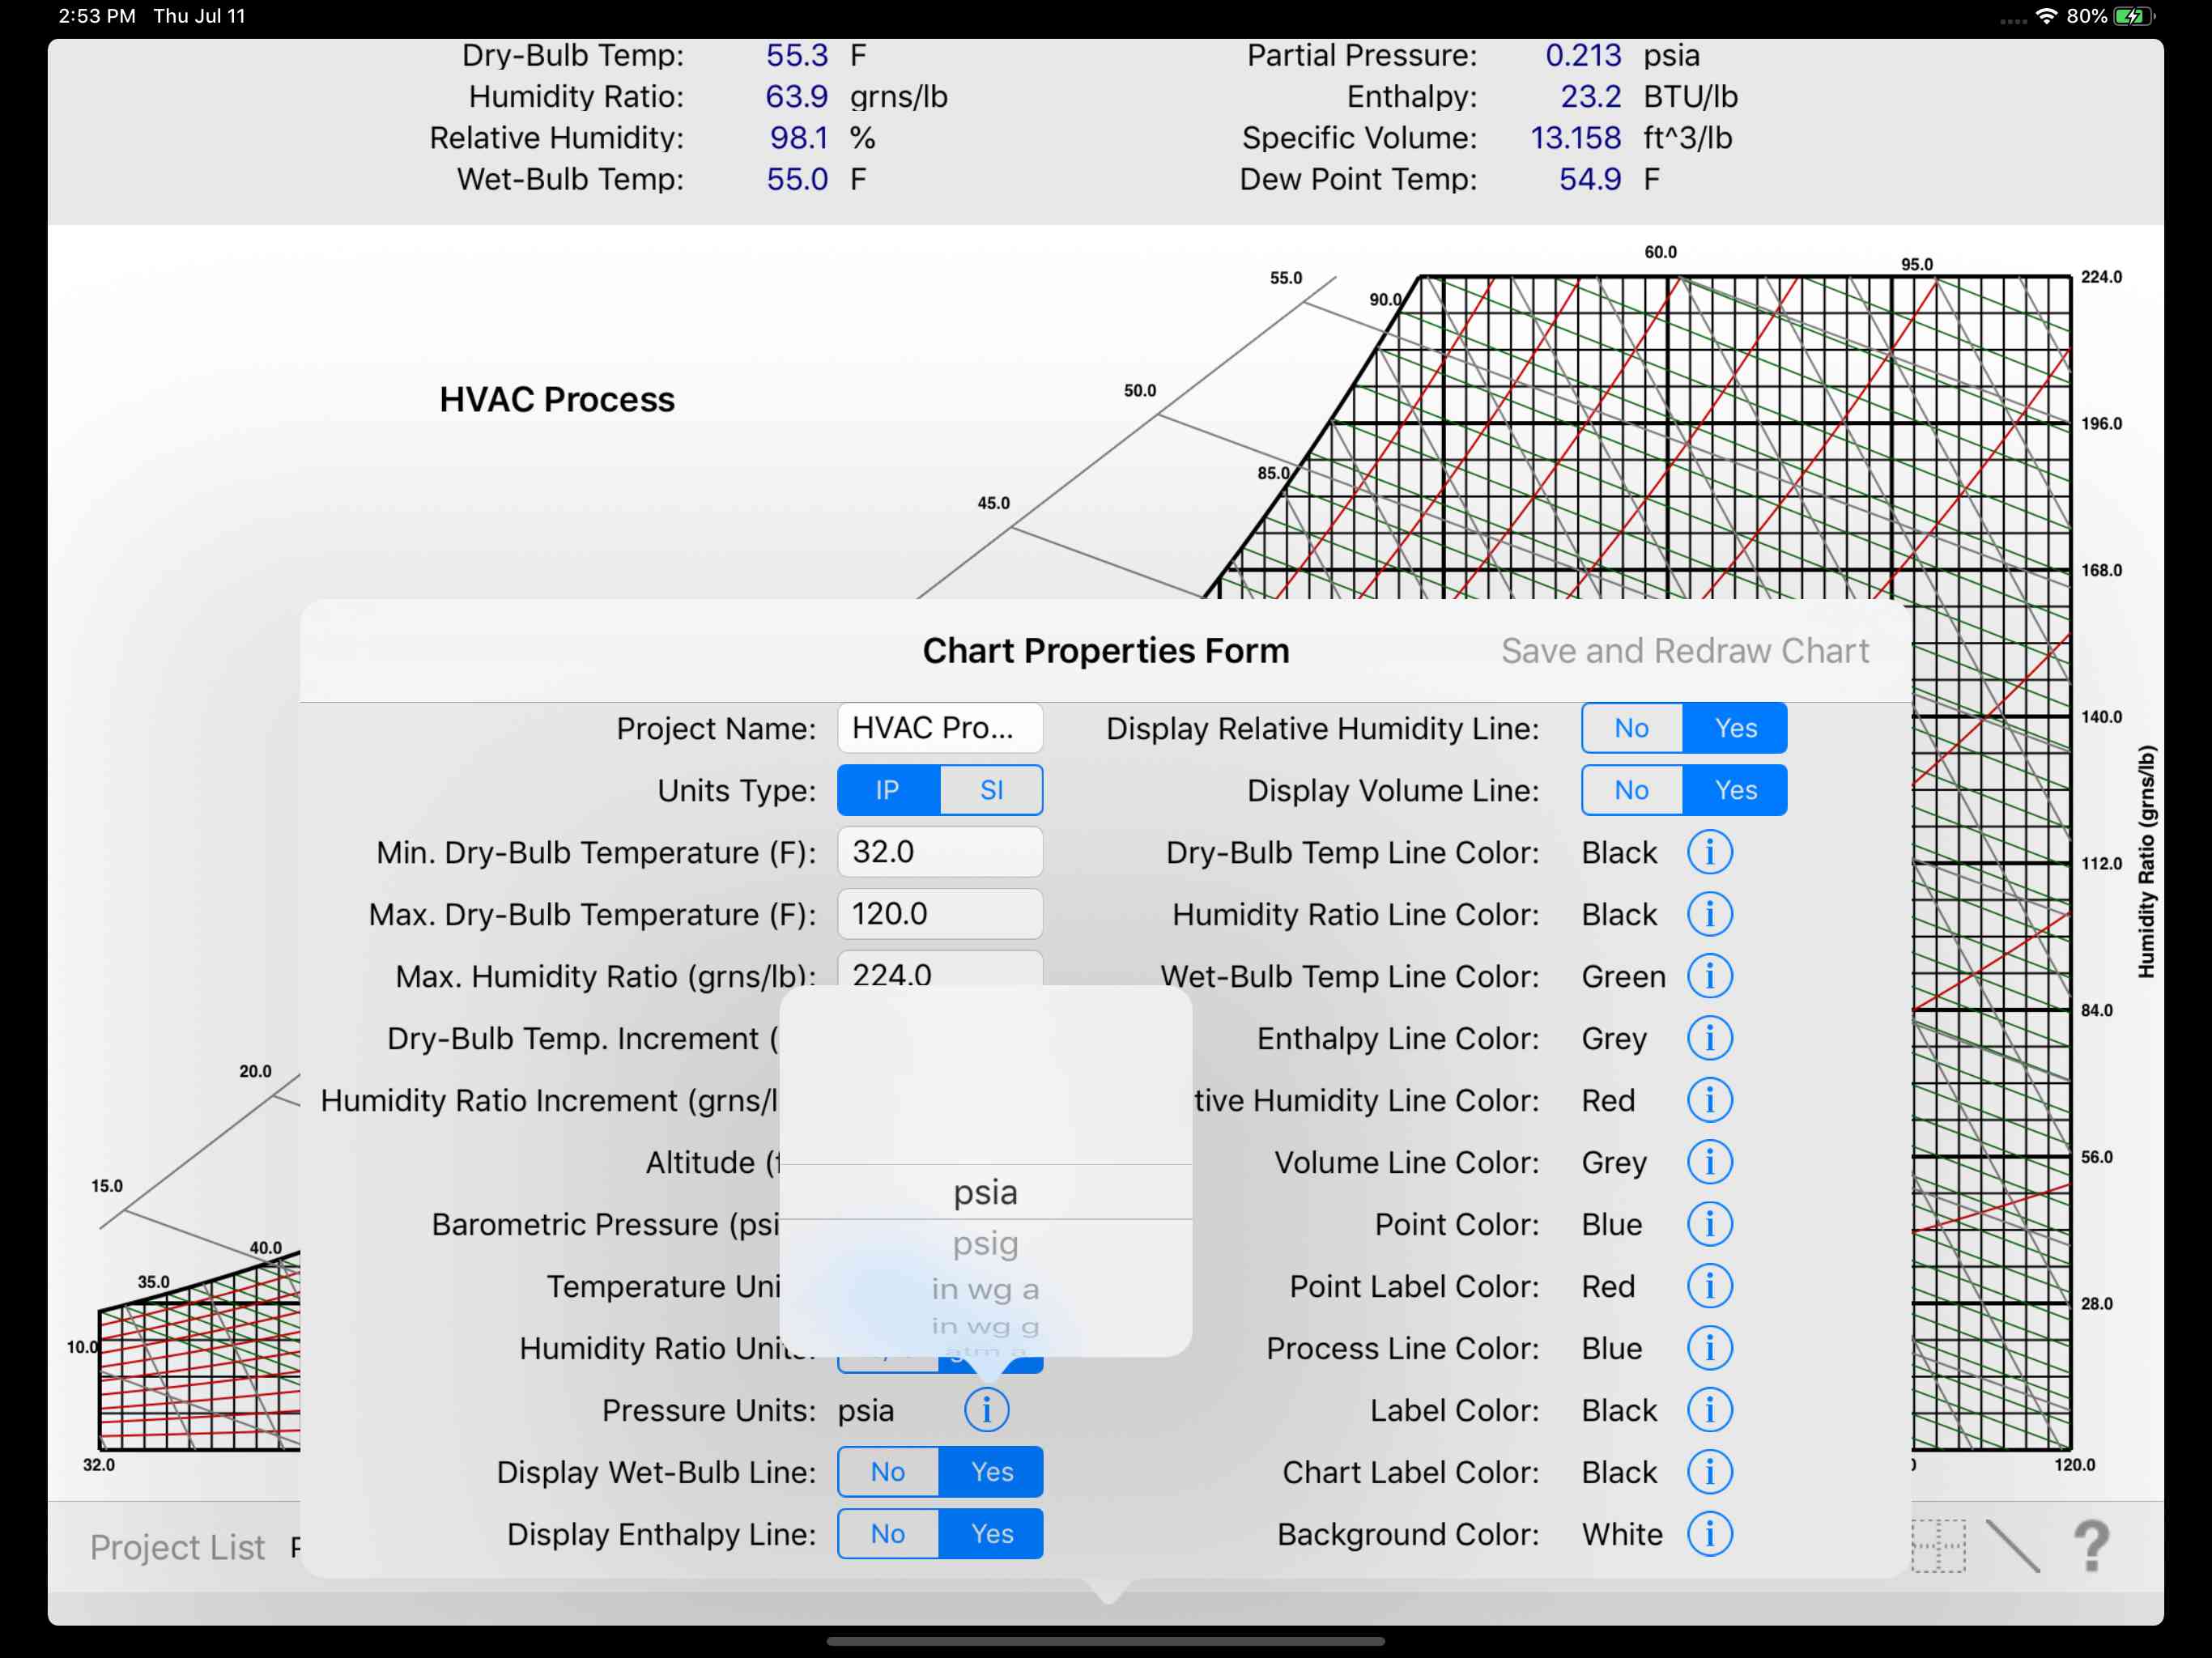
- Customize the graph in many different ways including specifying the psychrometric chart line colors, chart background color, hide/display status of chart lines, point colors, process line colors, units of graph values, and the min/max limits of the chart
- Create non-standard charts with high maximum dry-bulb temperatures or ones for high altitudes and low barometric pressures
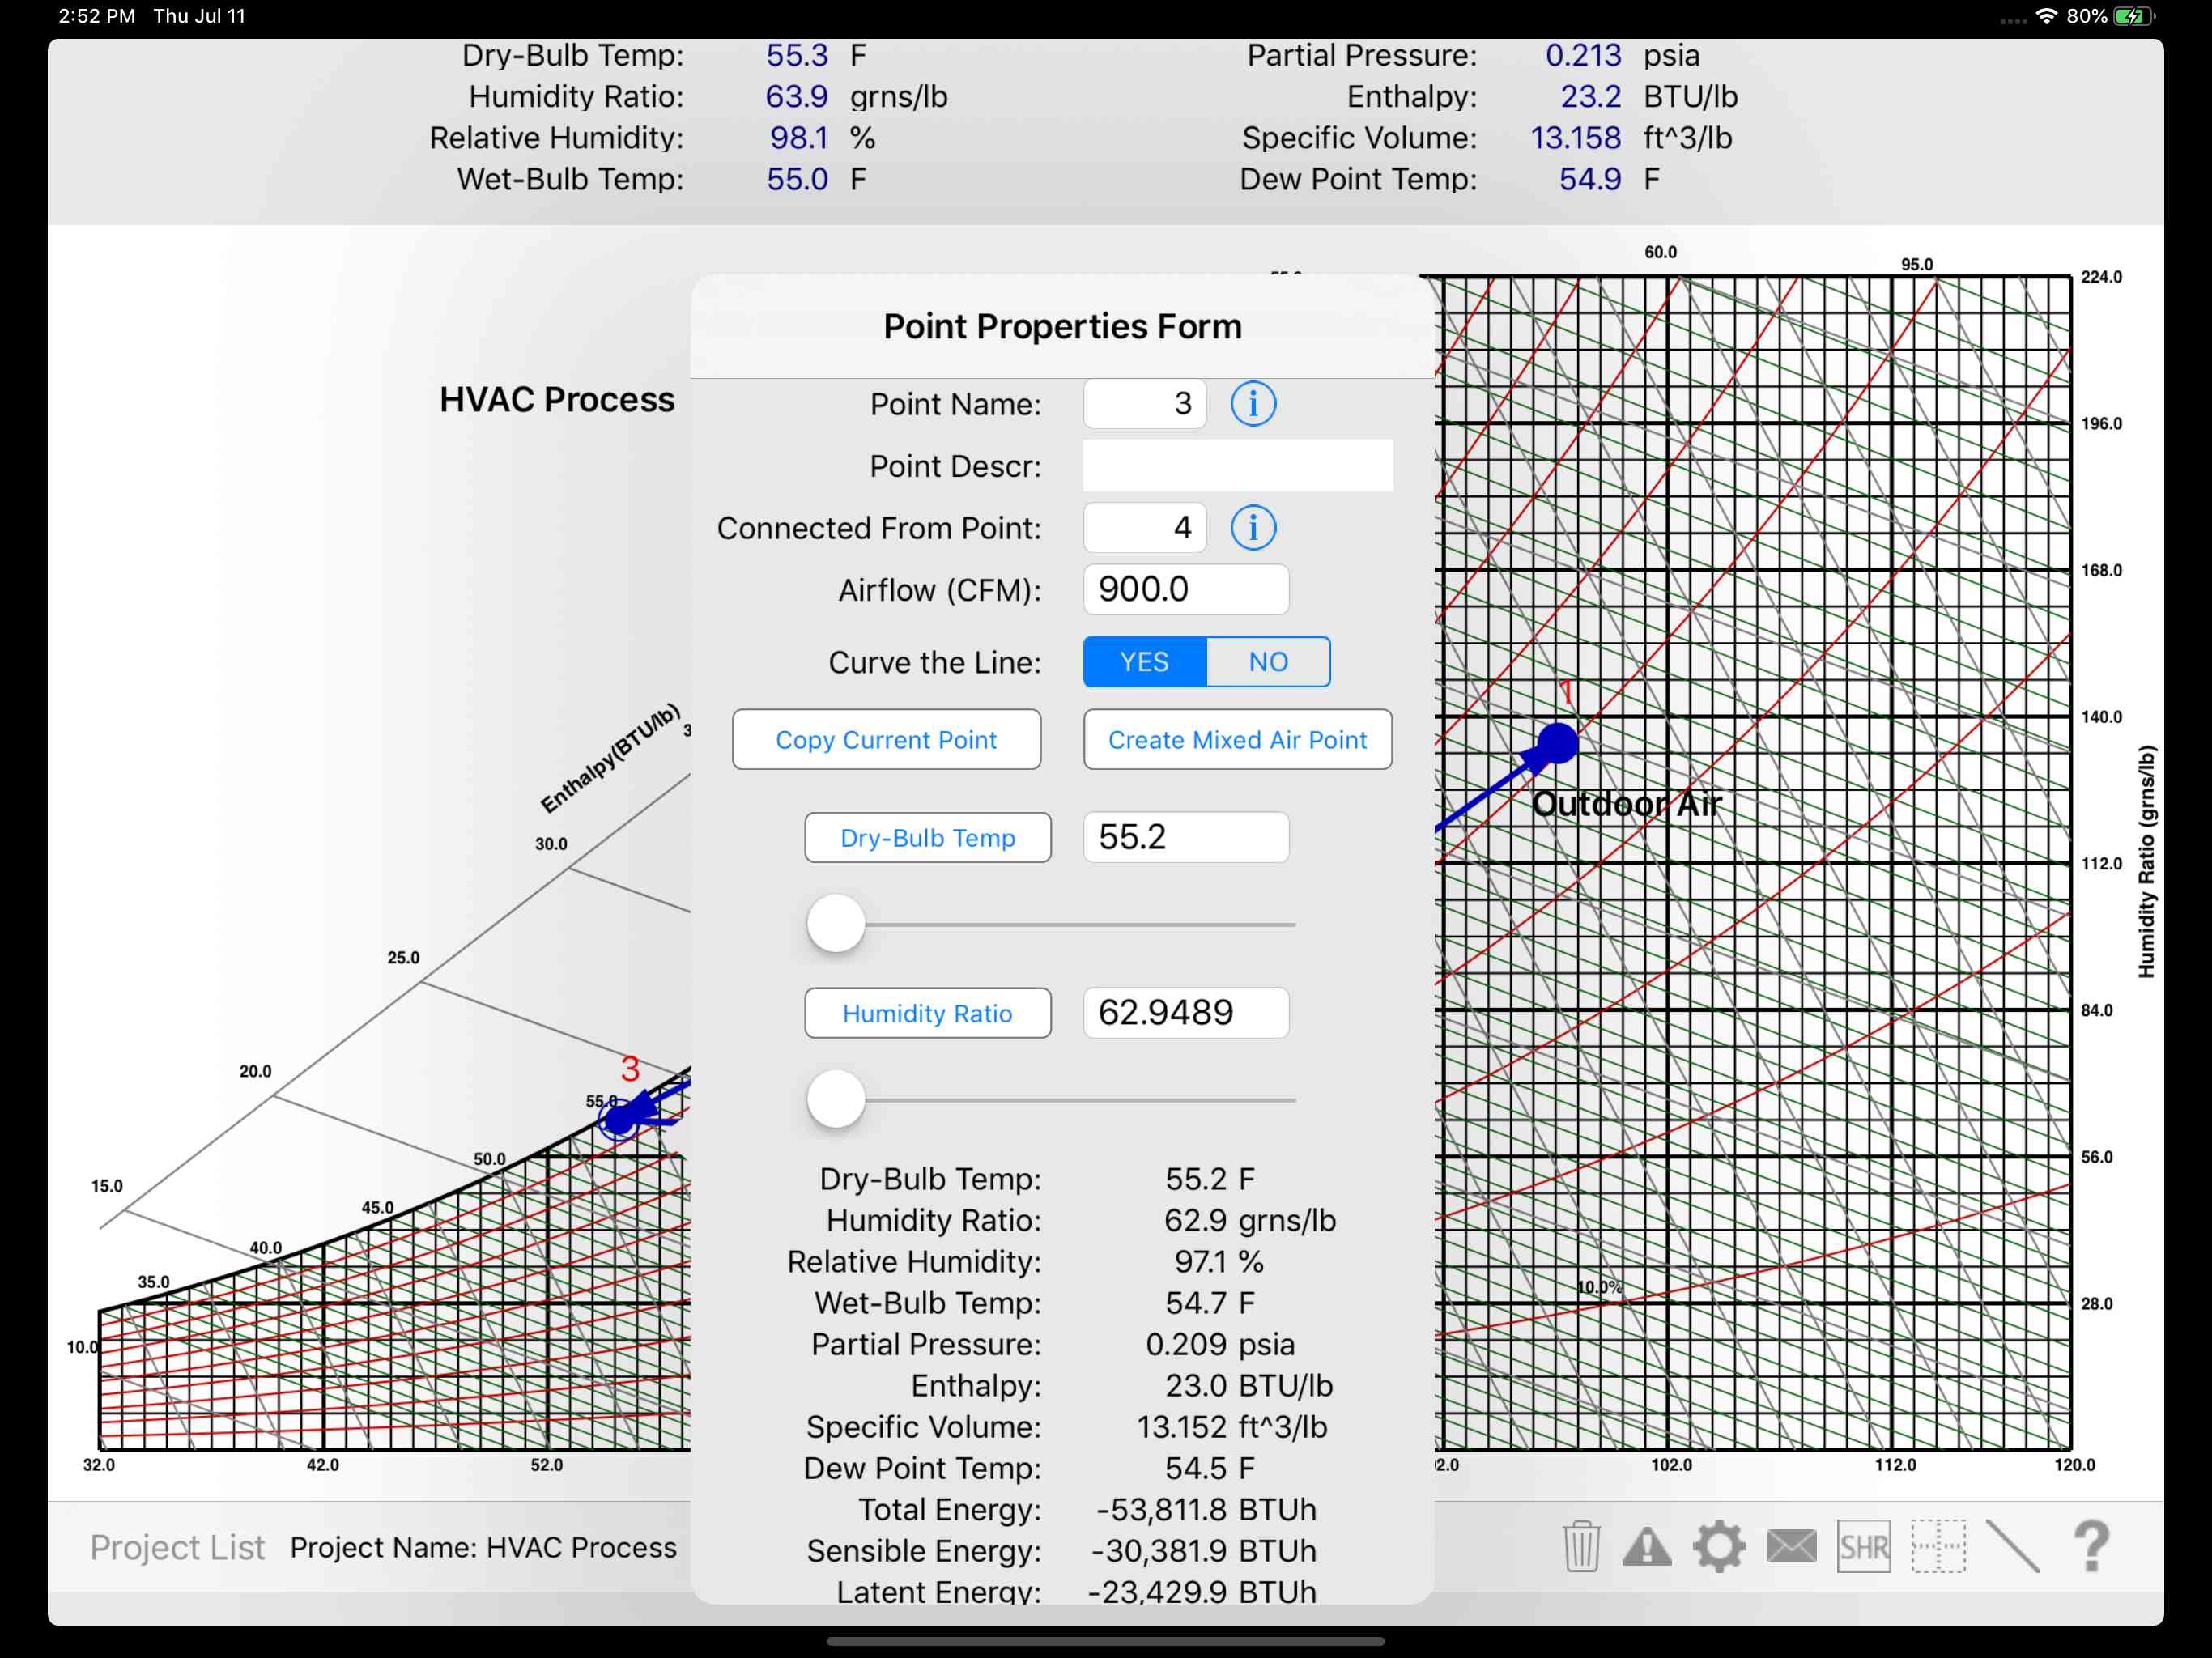
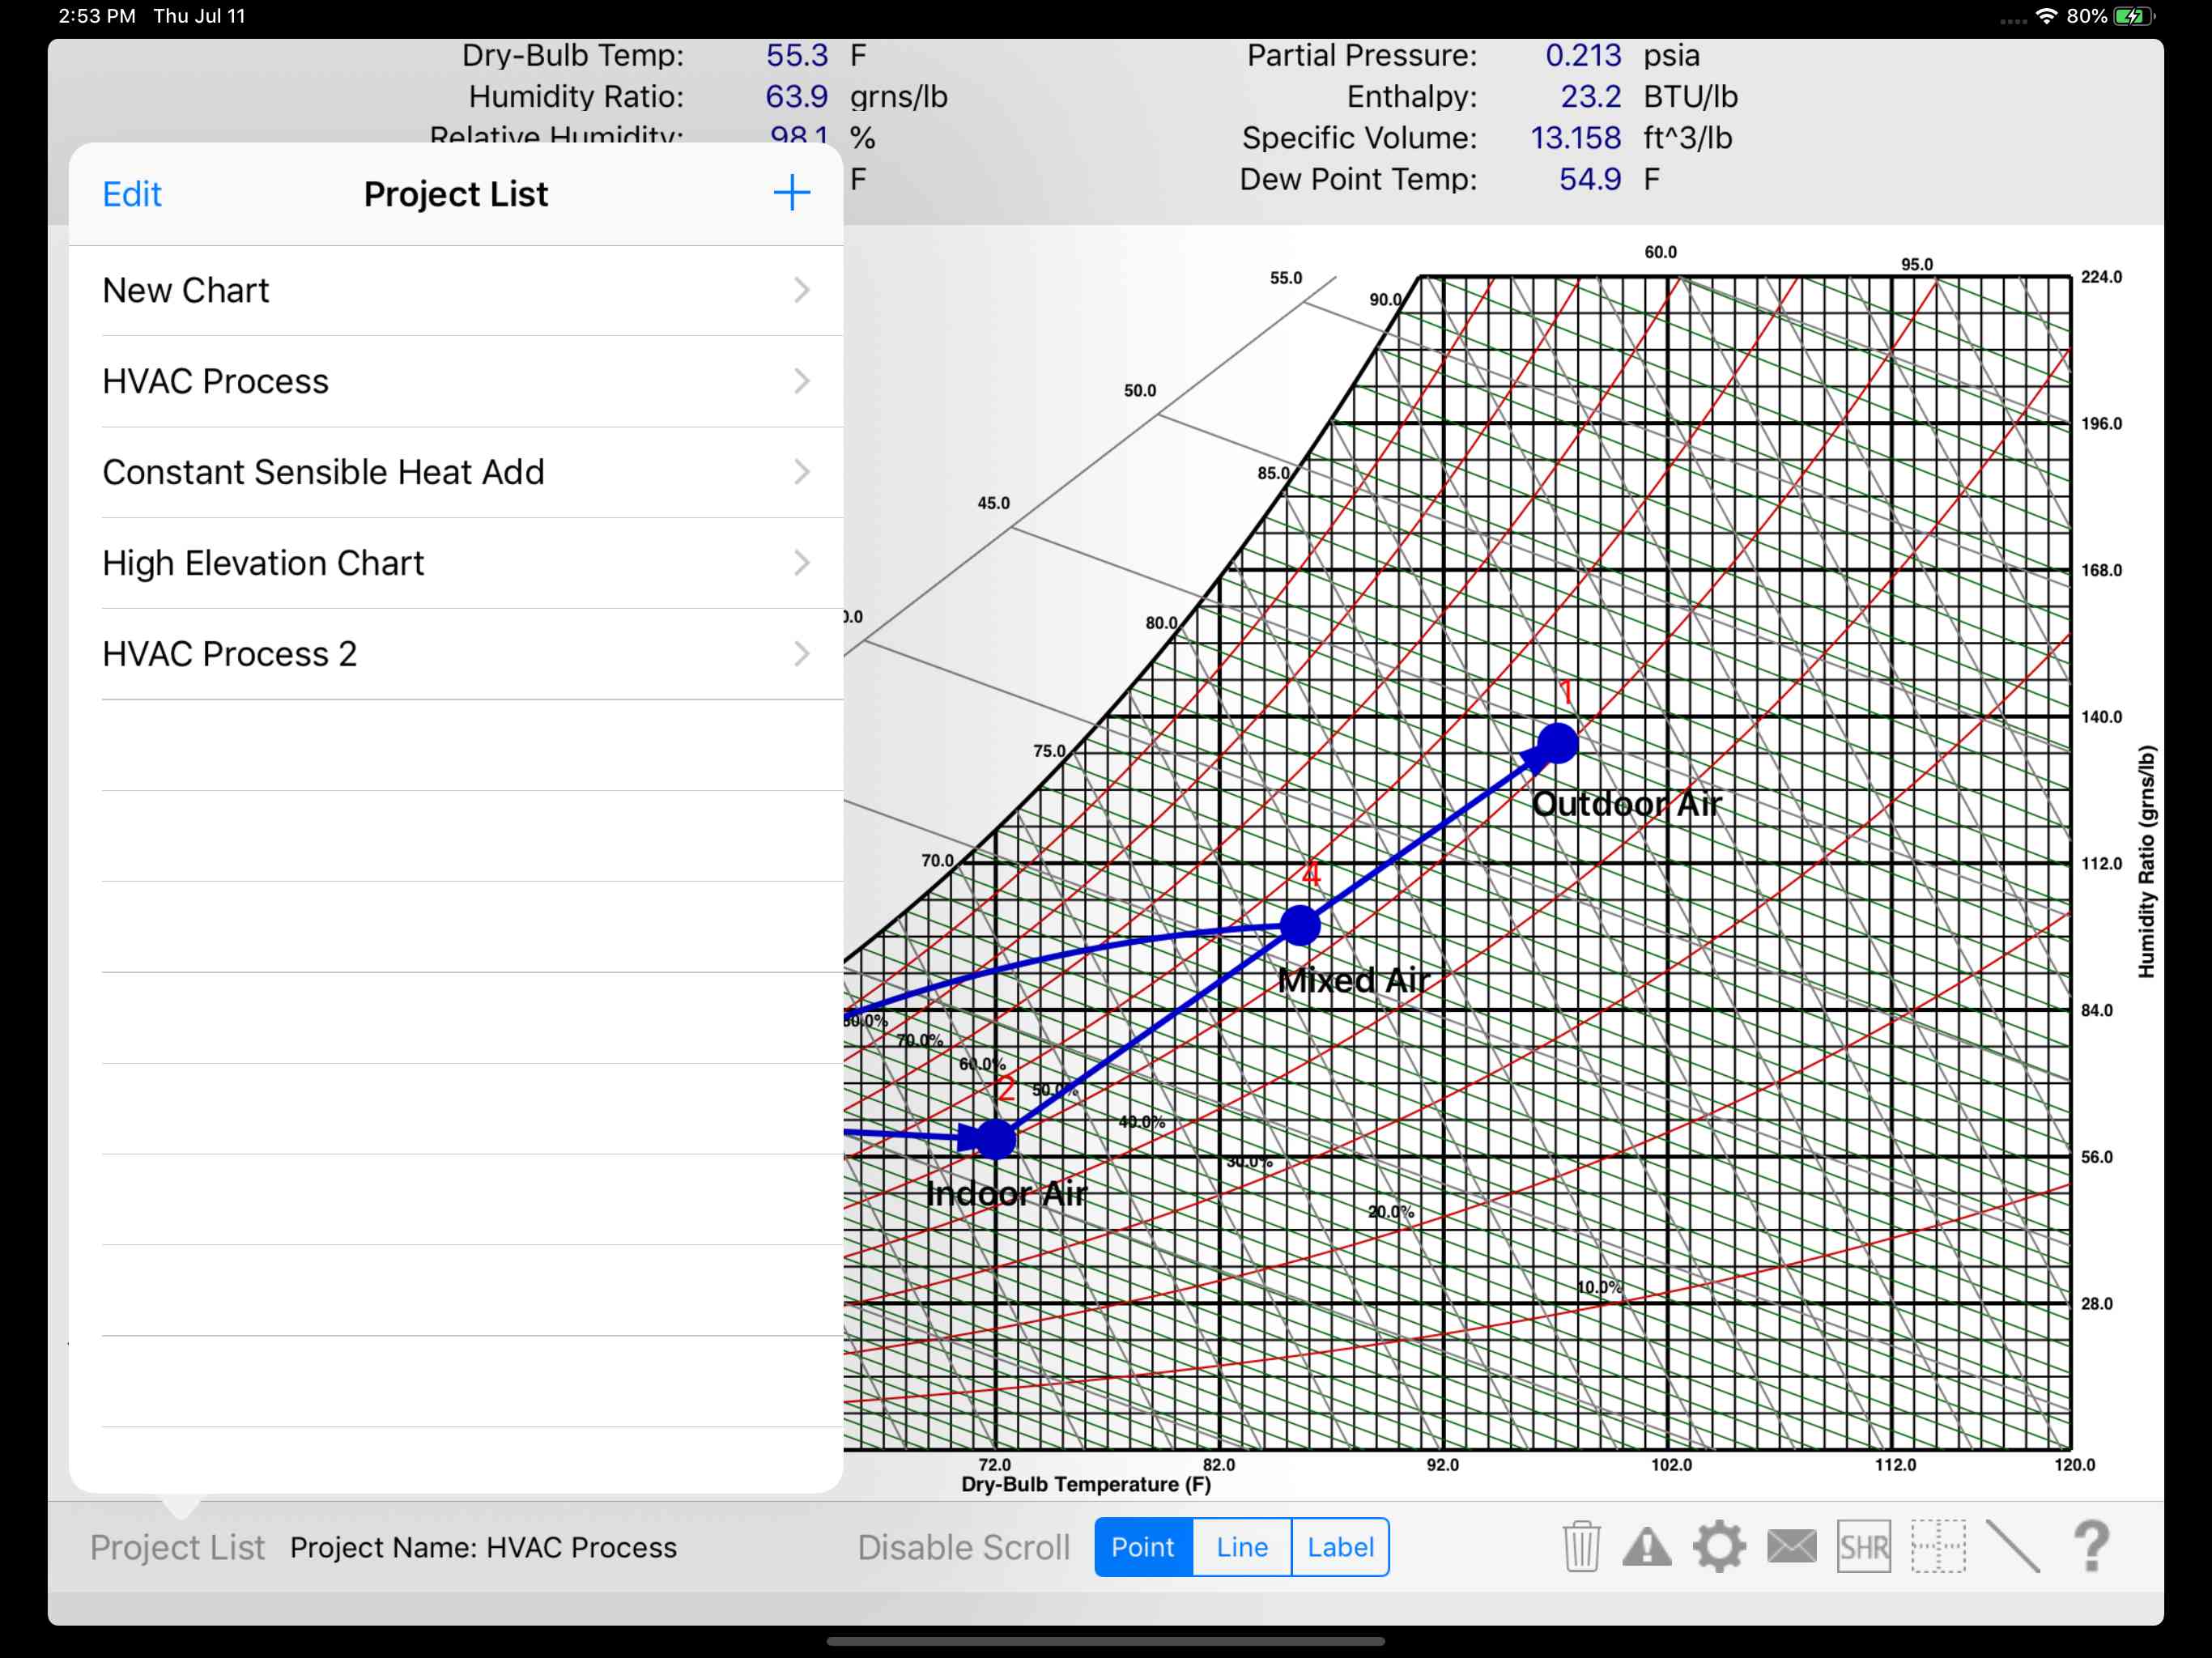
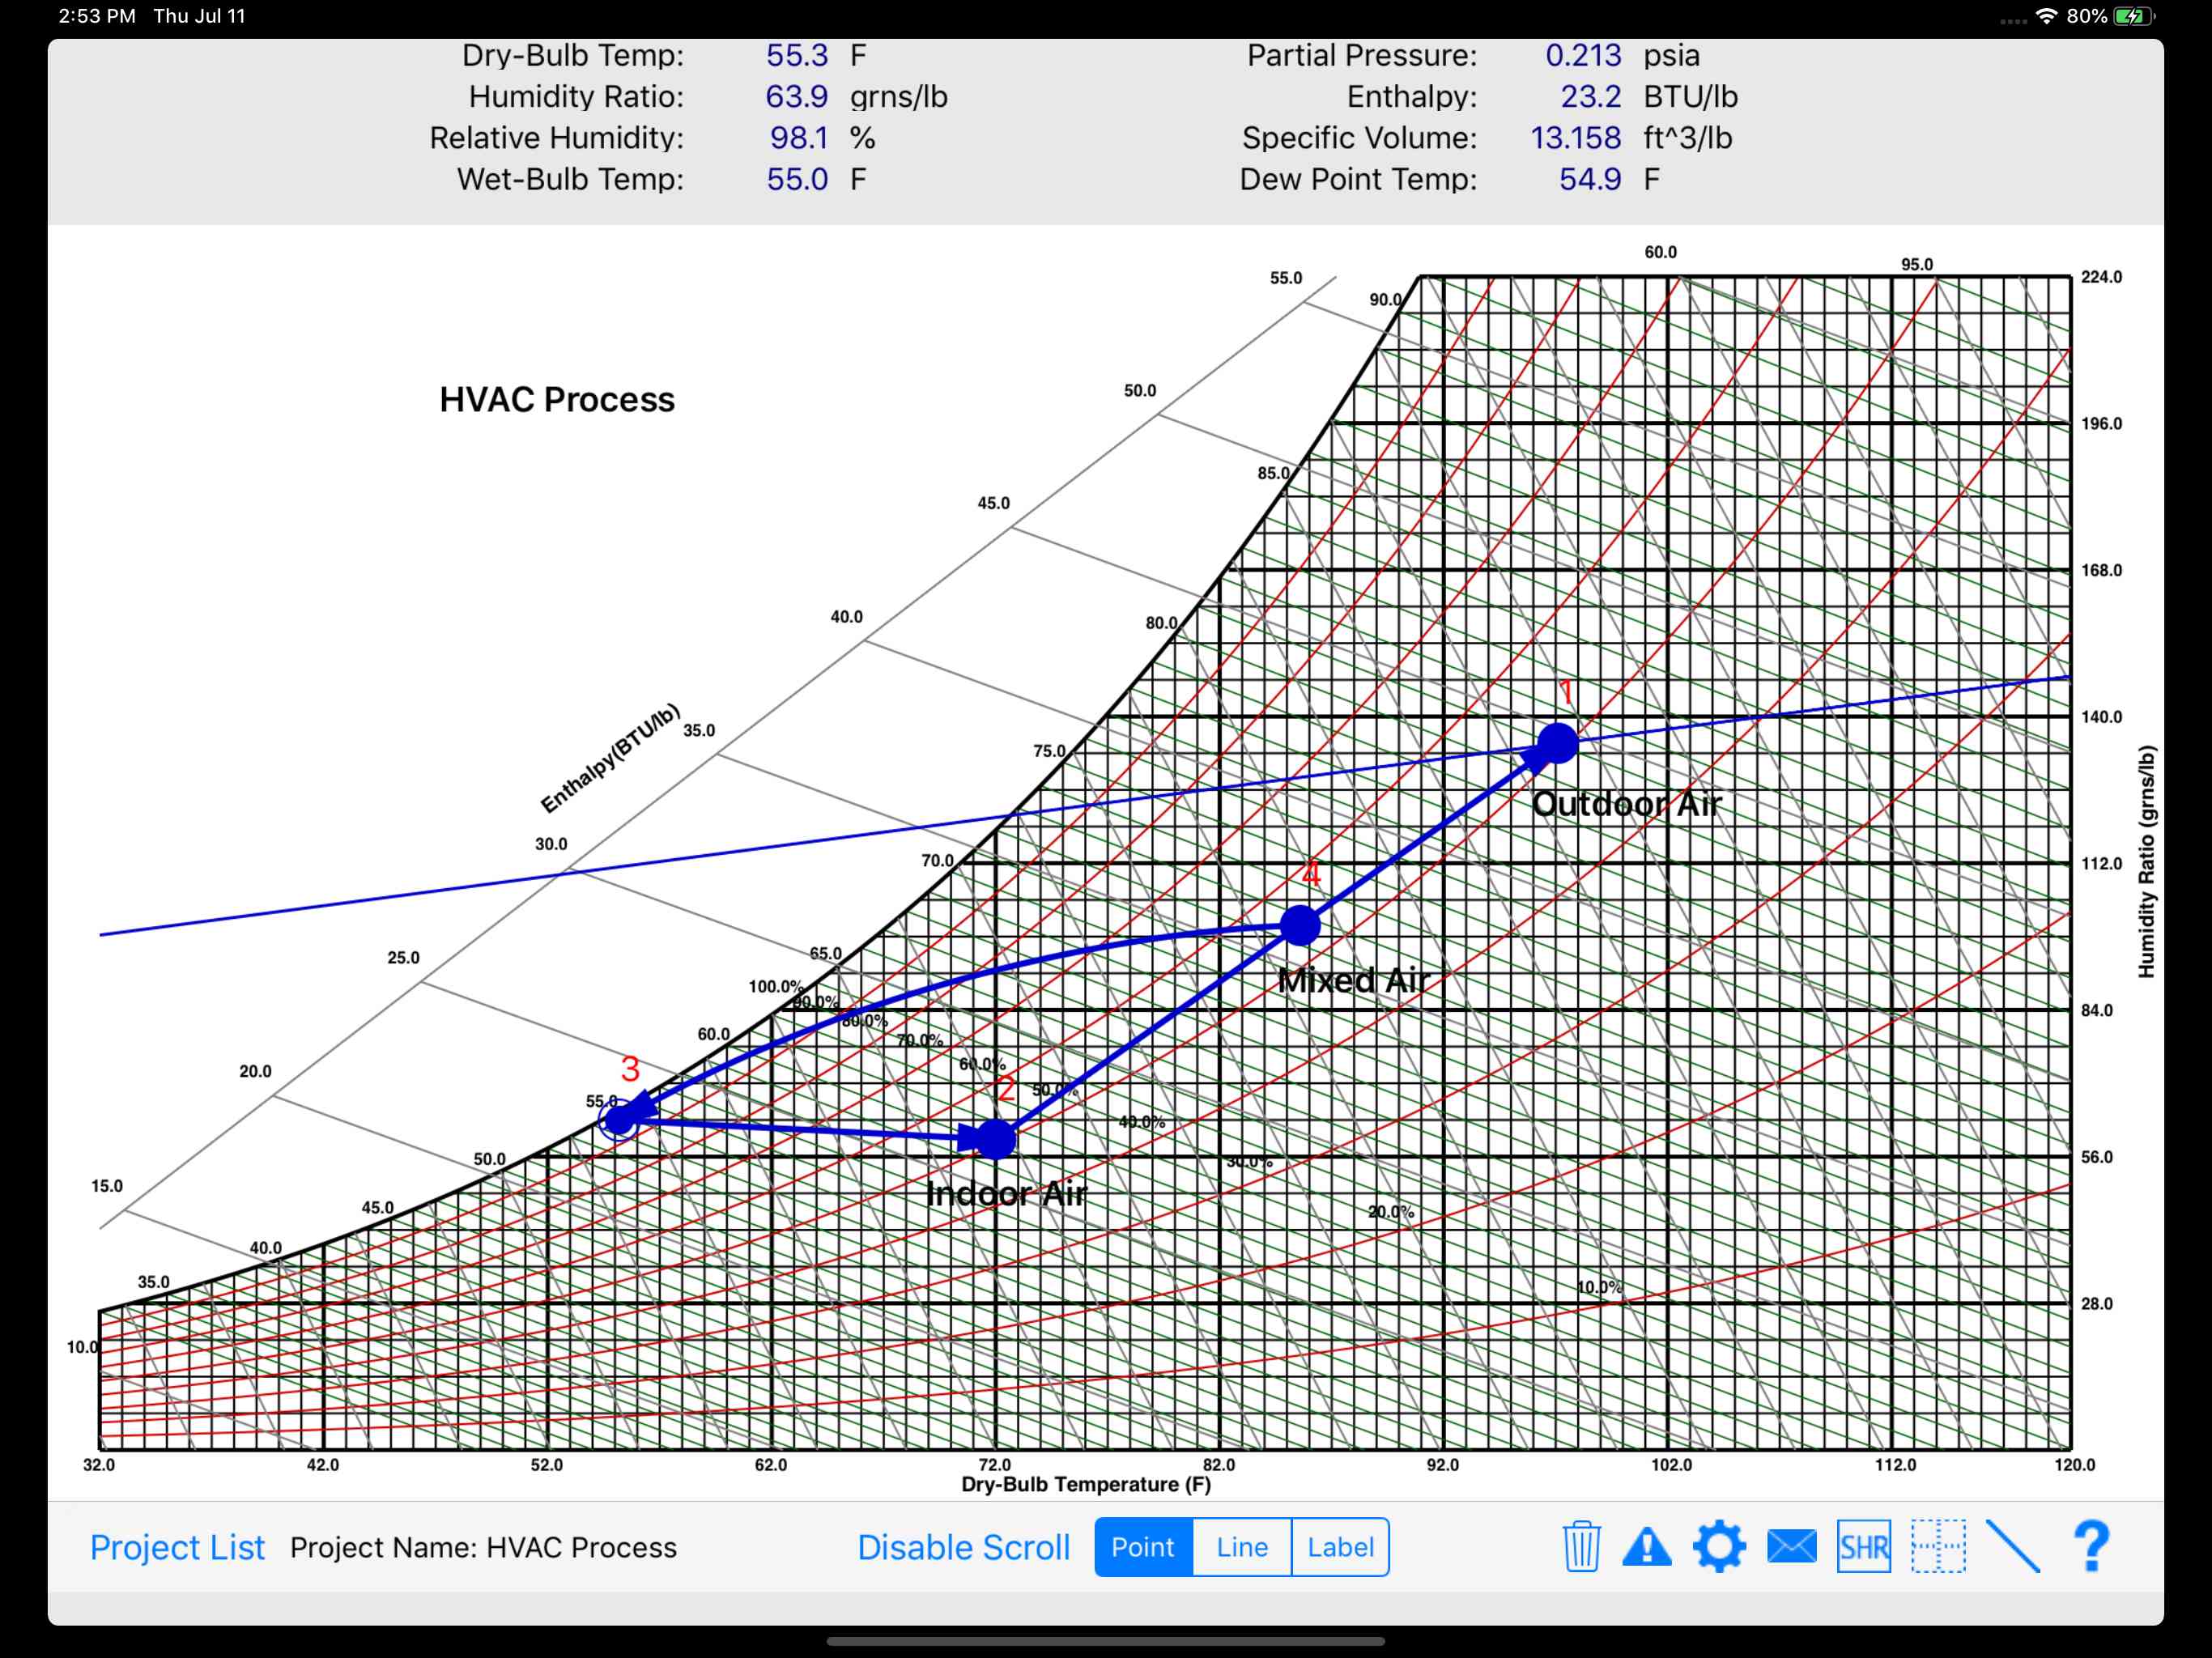
- Using your finger, plot as many points as you want on the screen. As you move your finger around the graph, the psychrometric properties at the top of the screen dynamically update. In addition, you can double-tap a point to display the point properties and then edit them
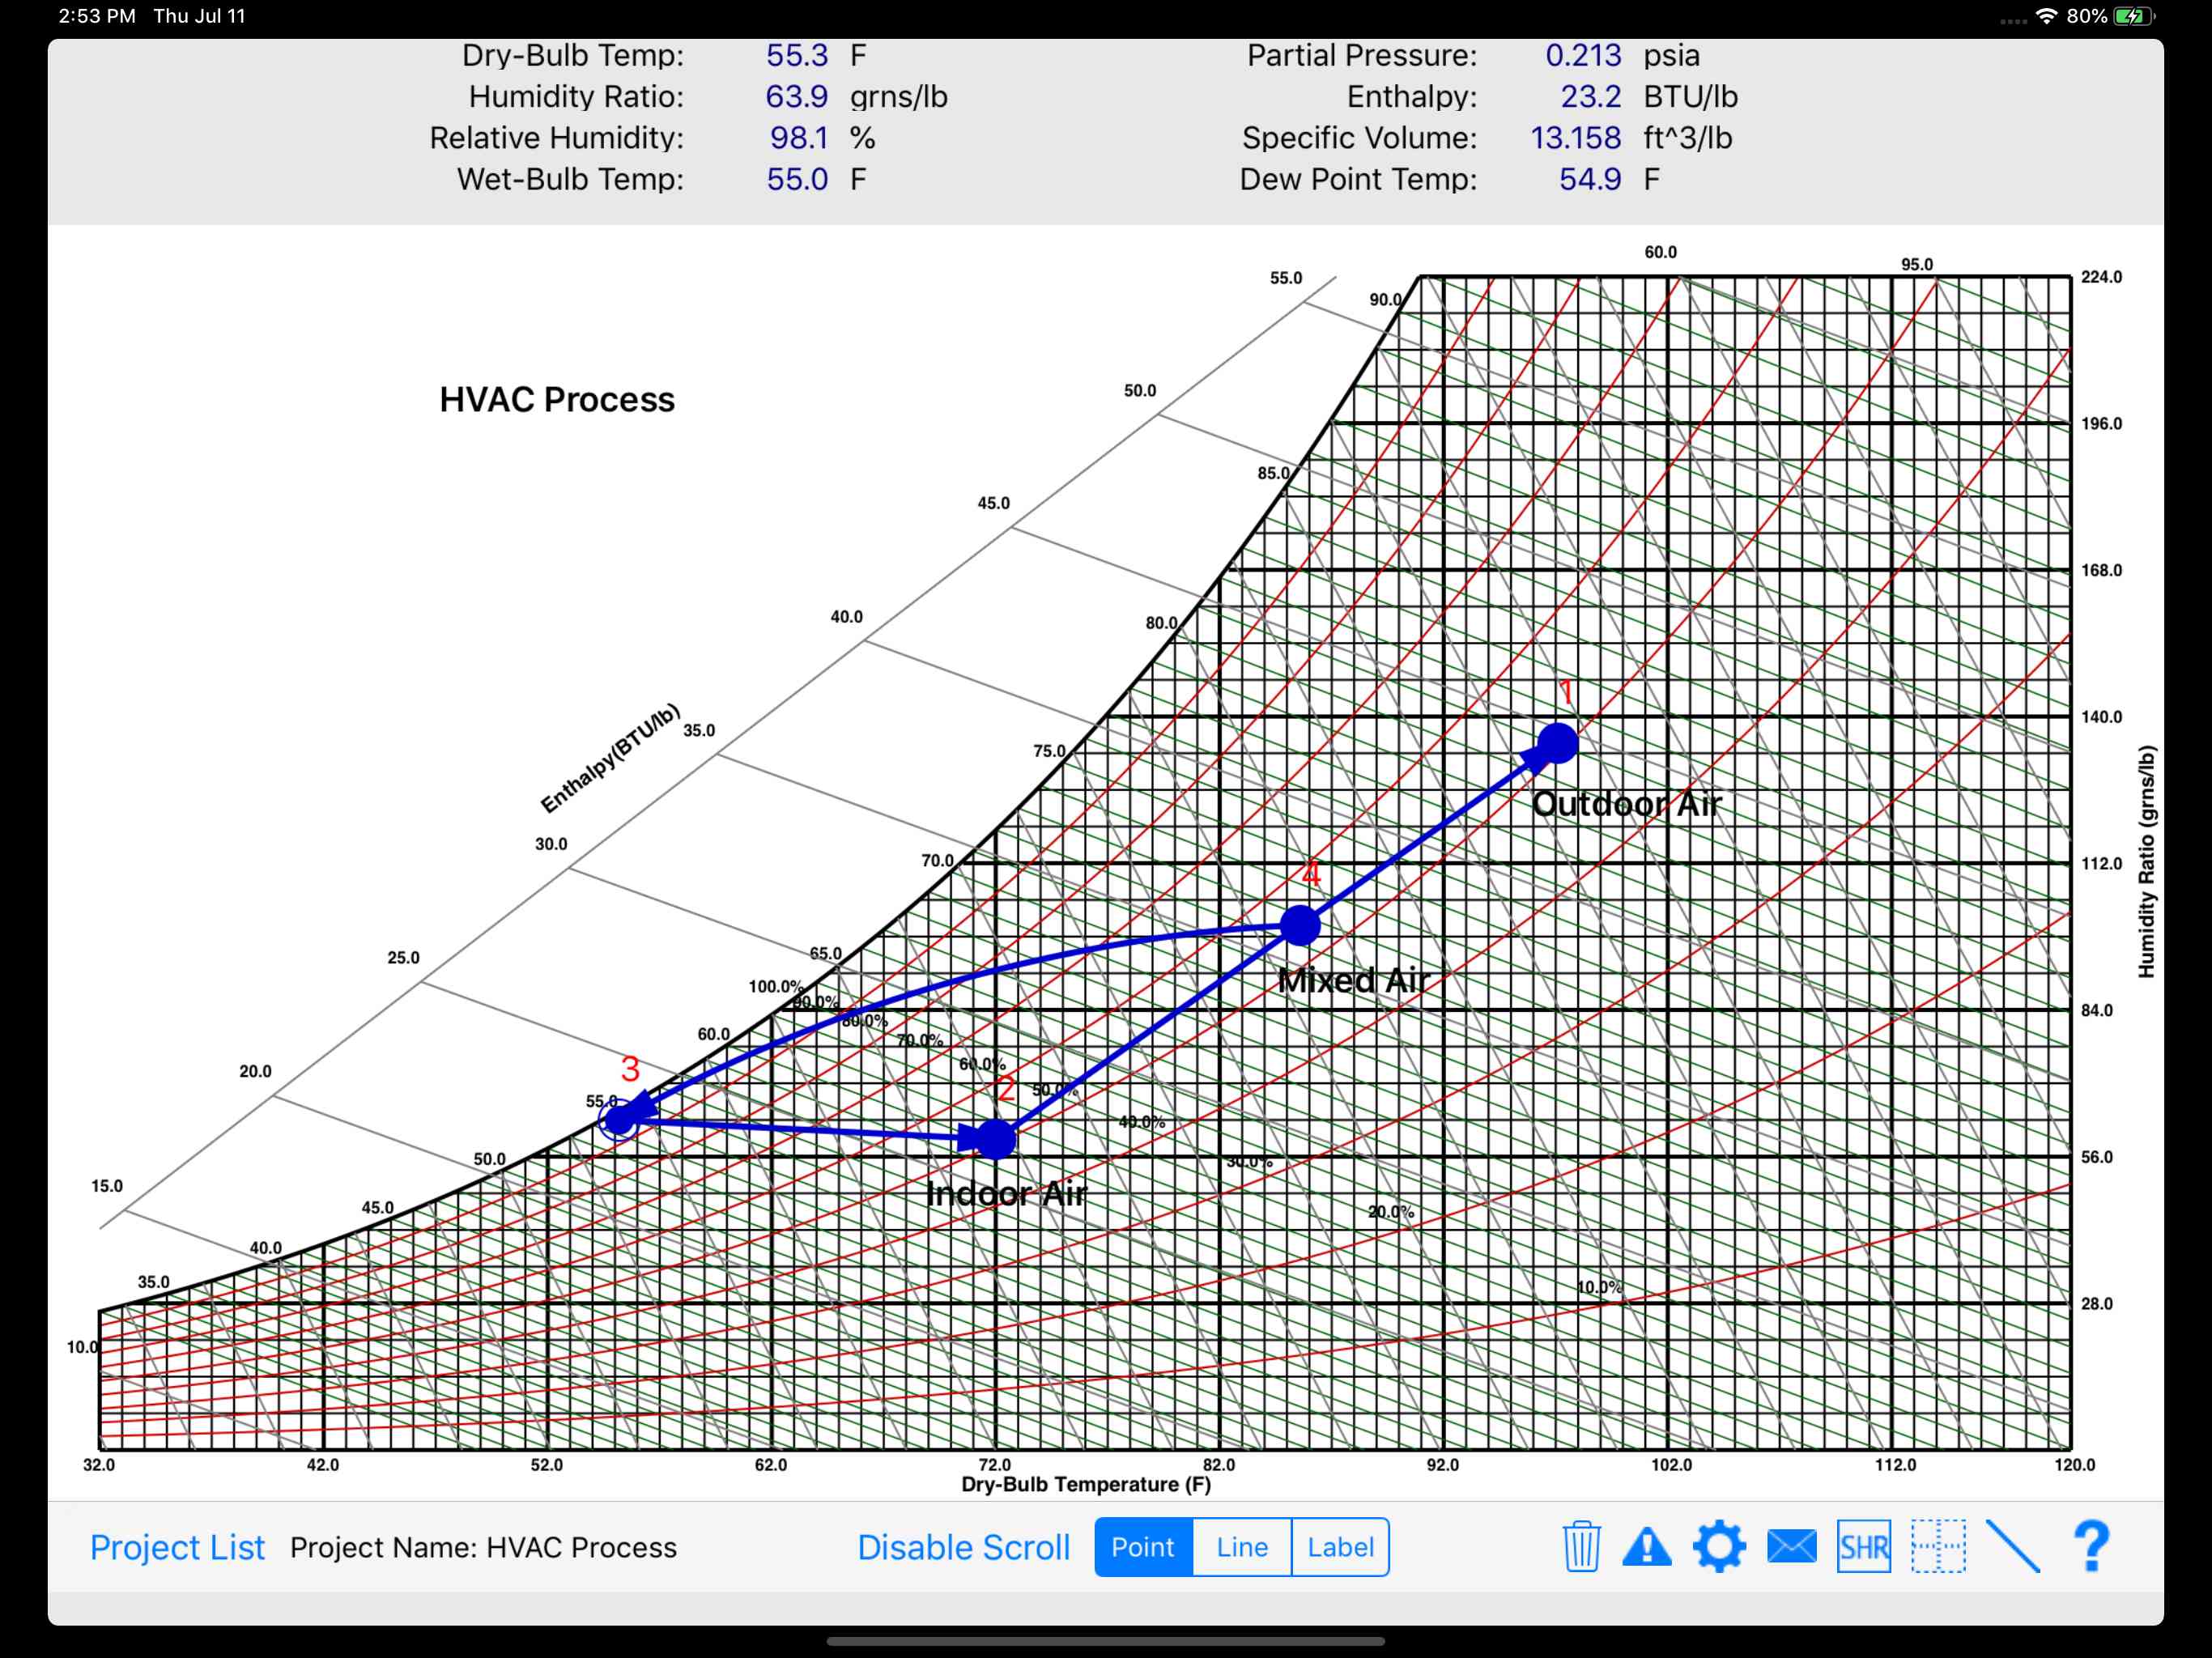
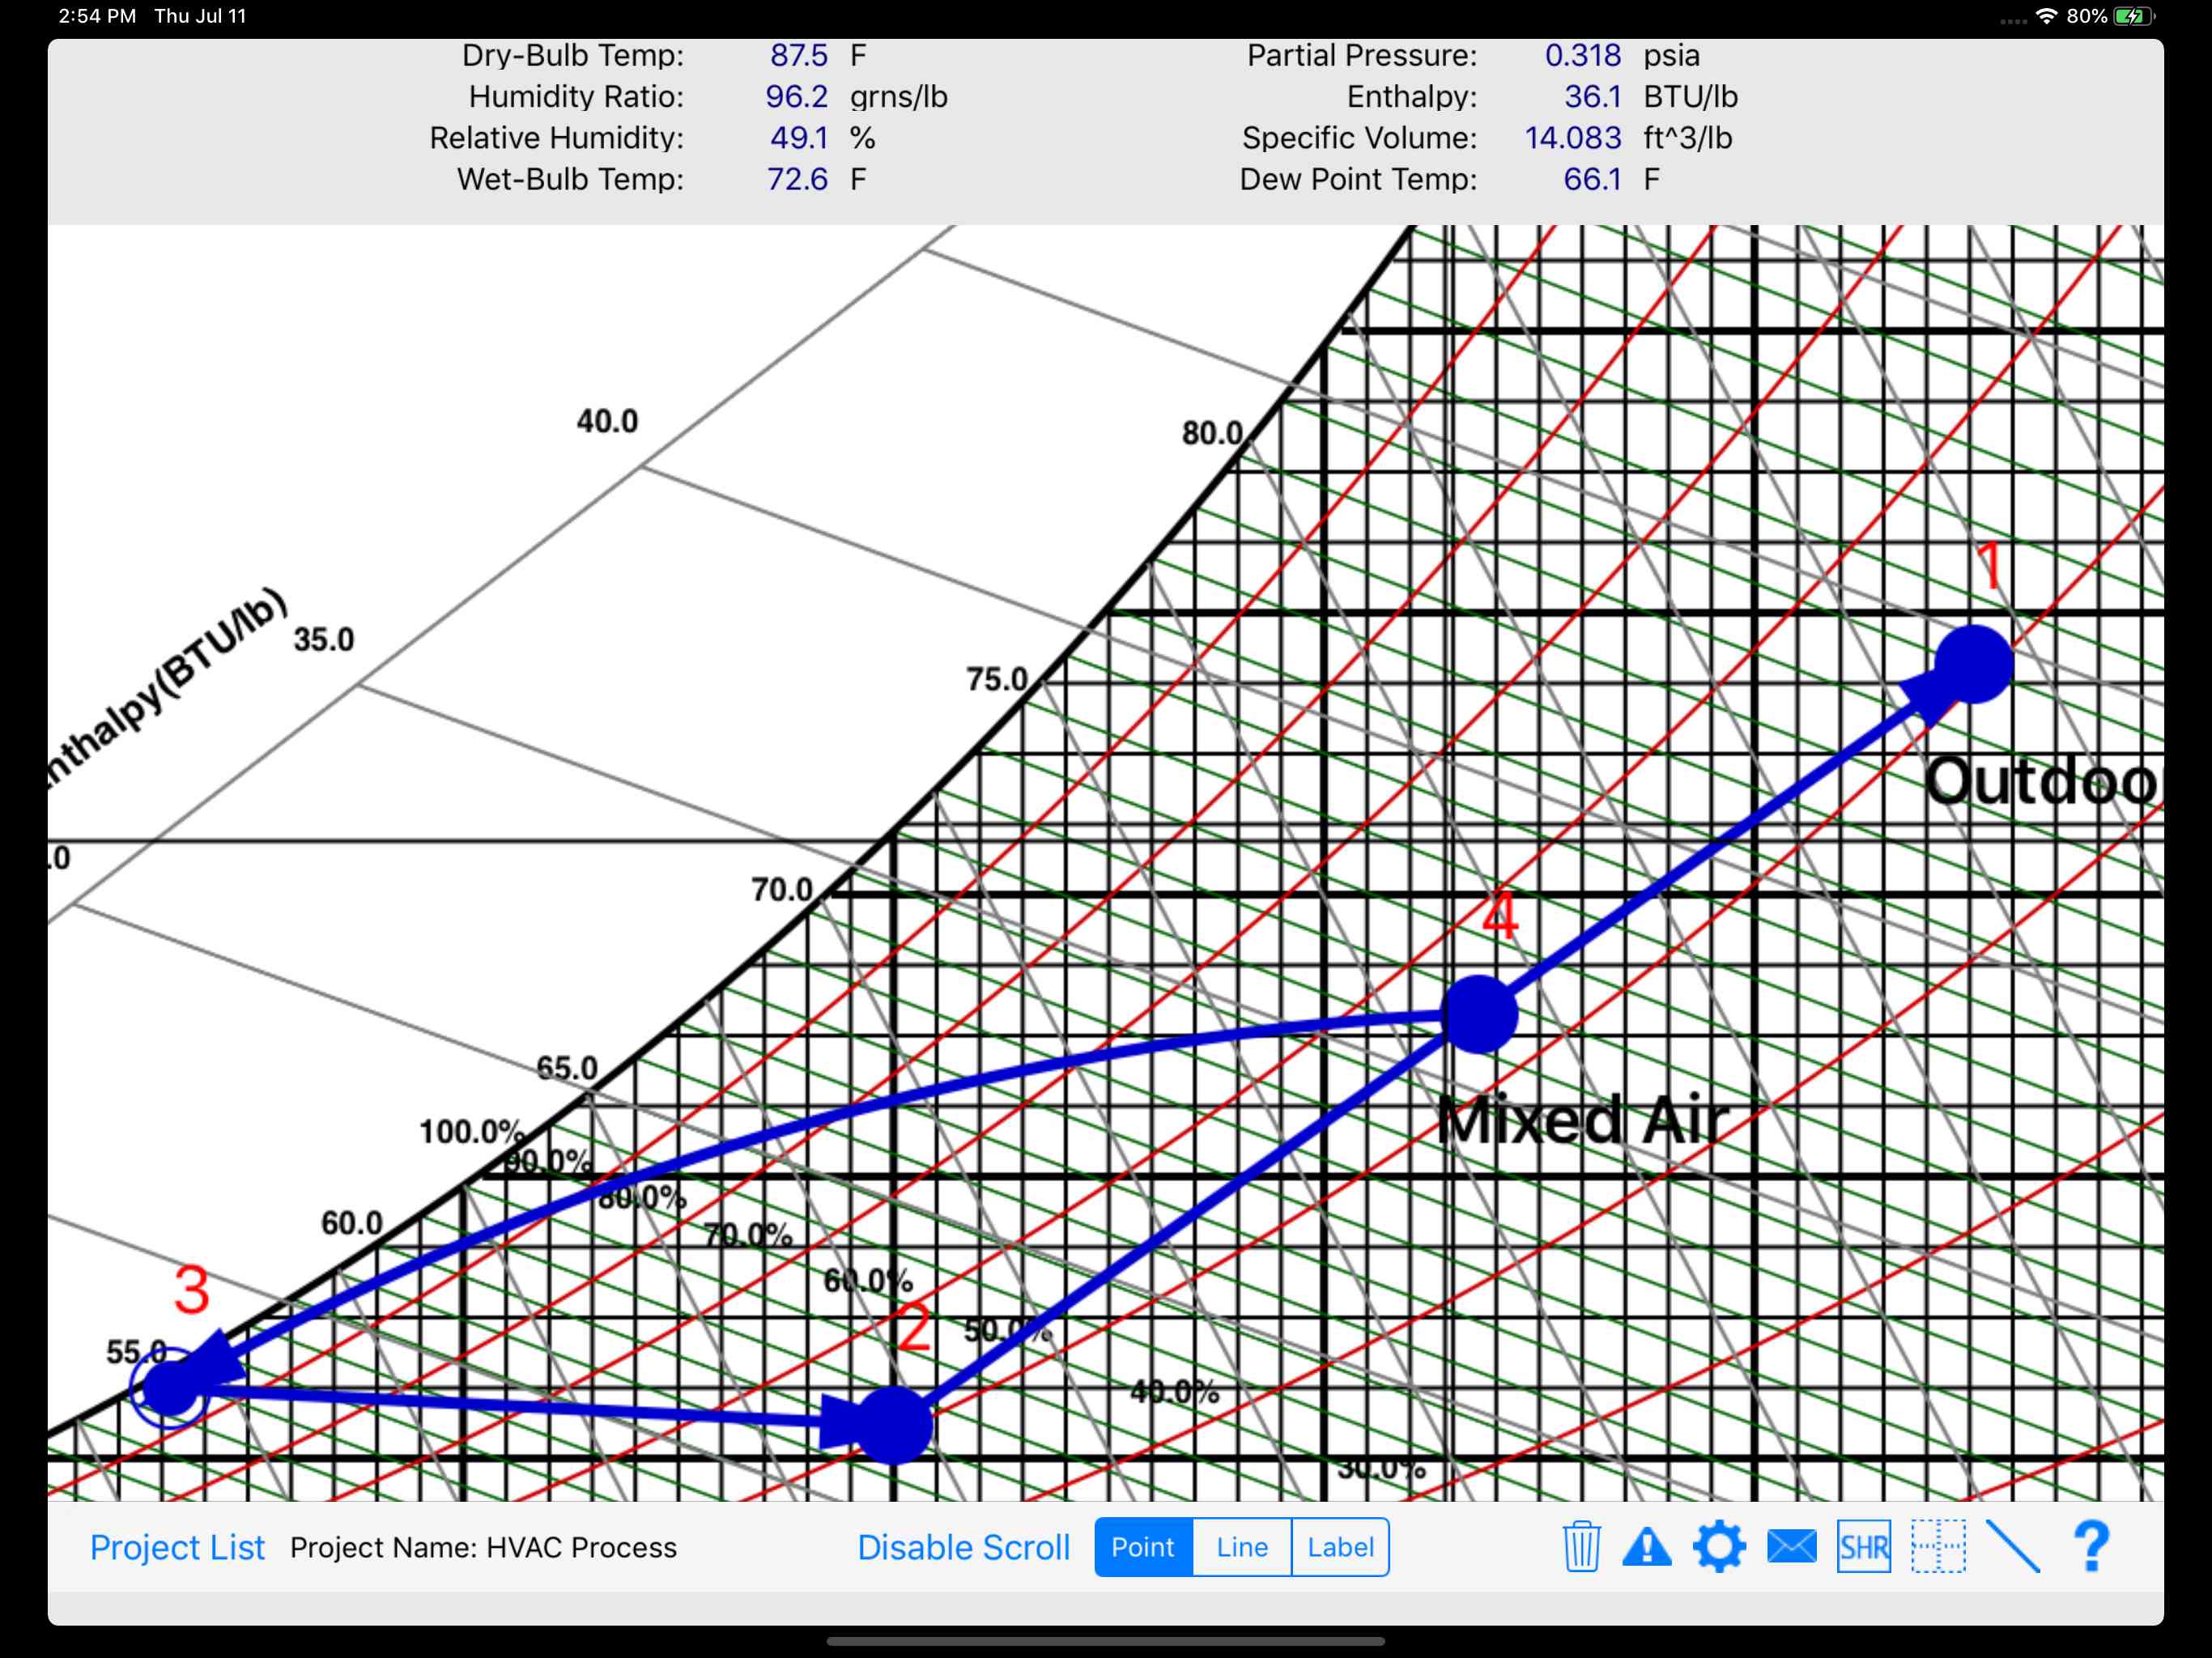
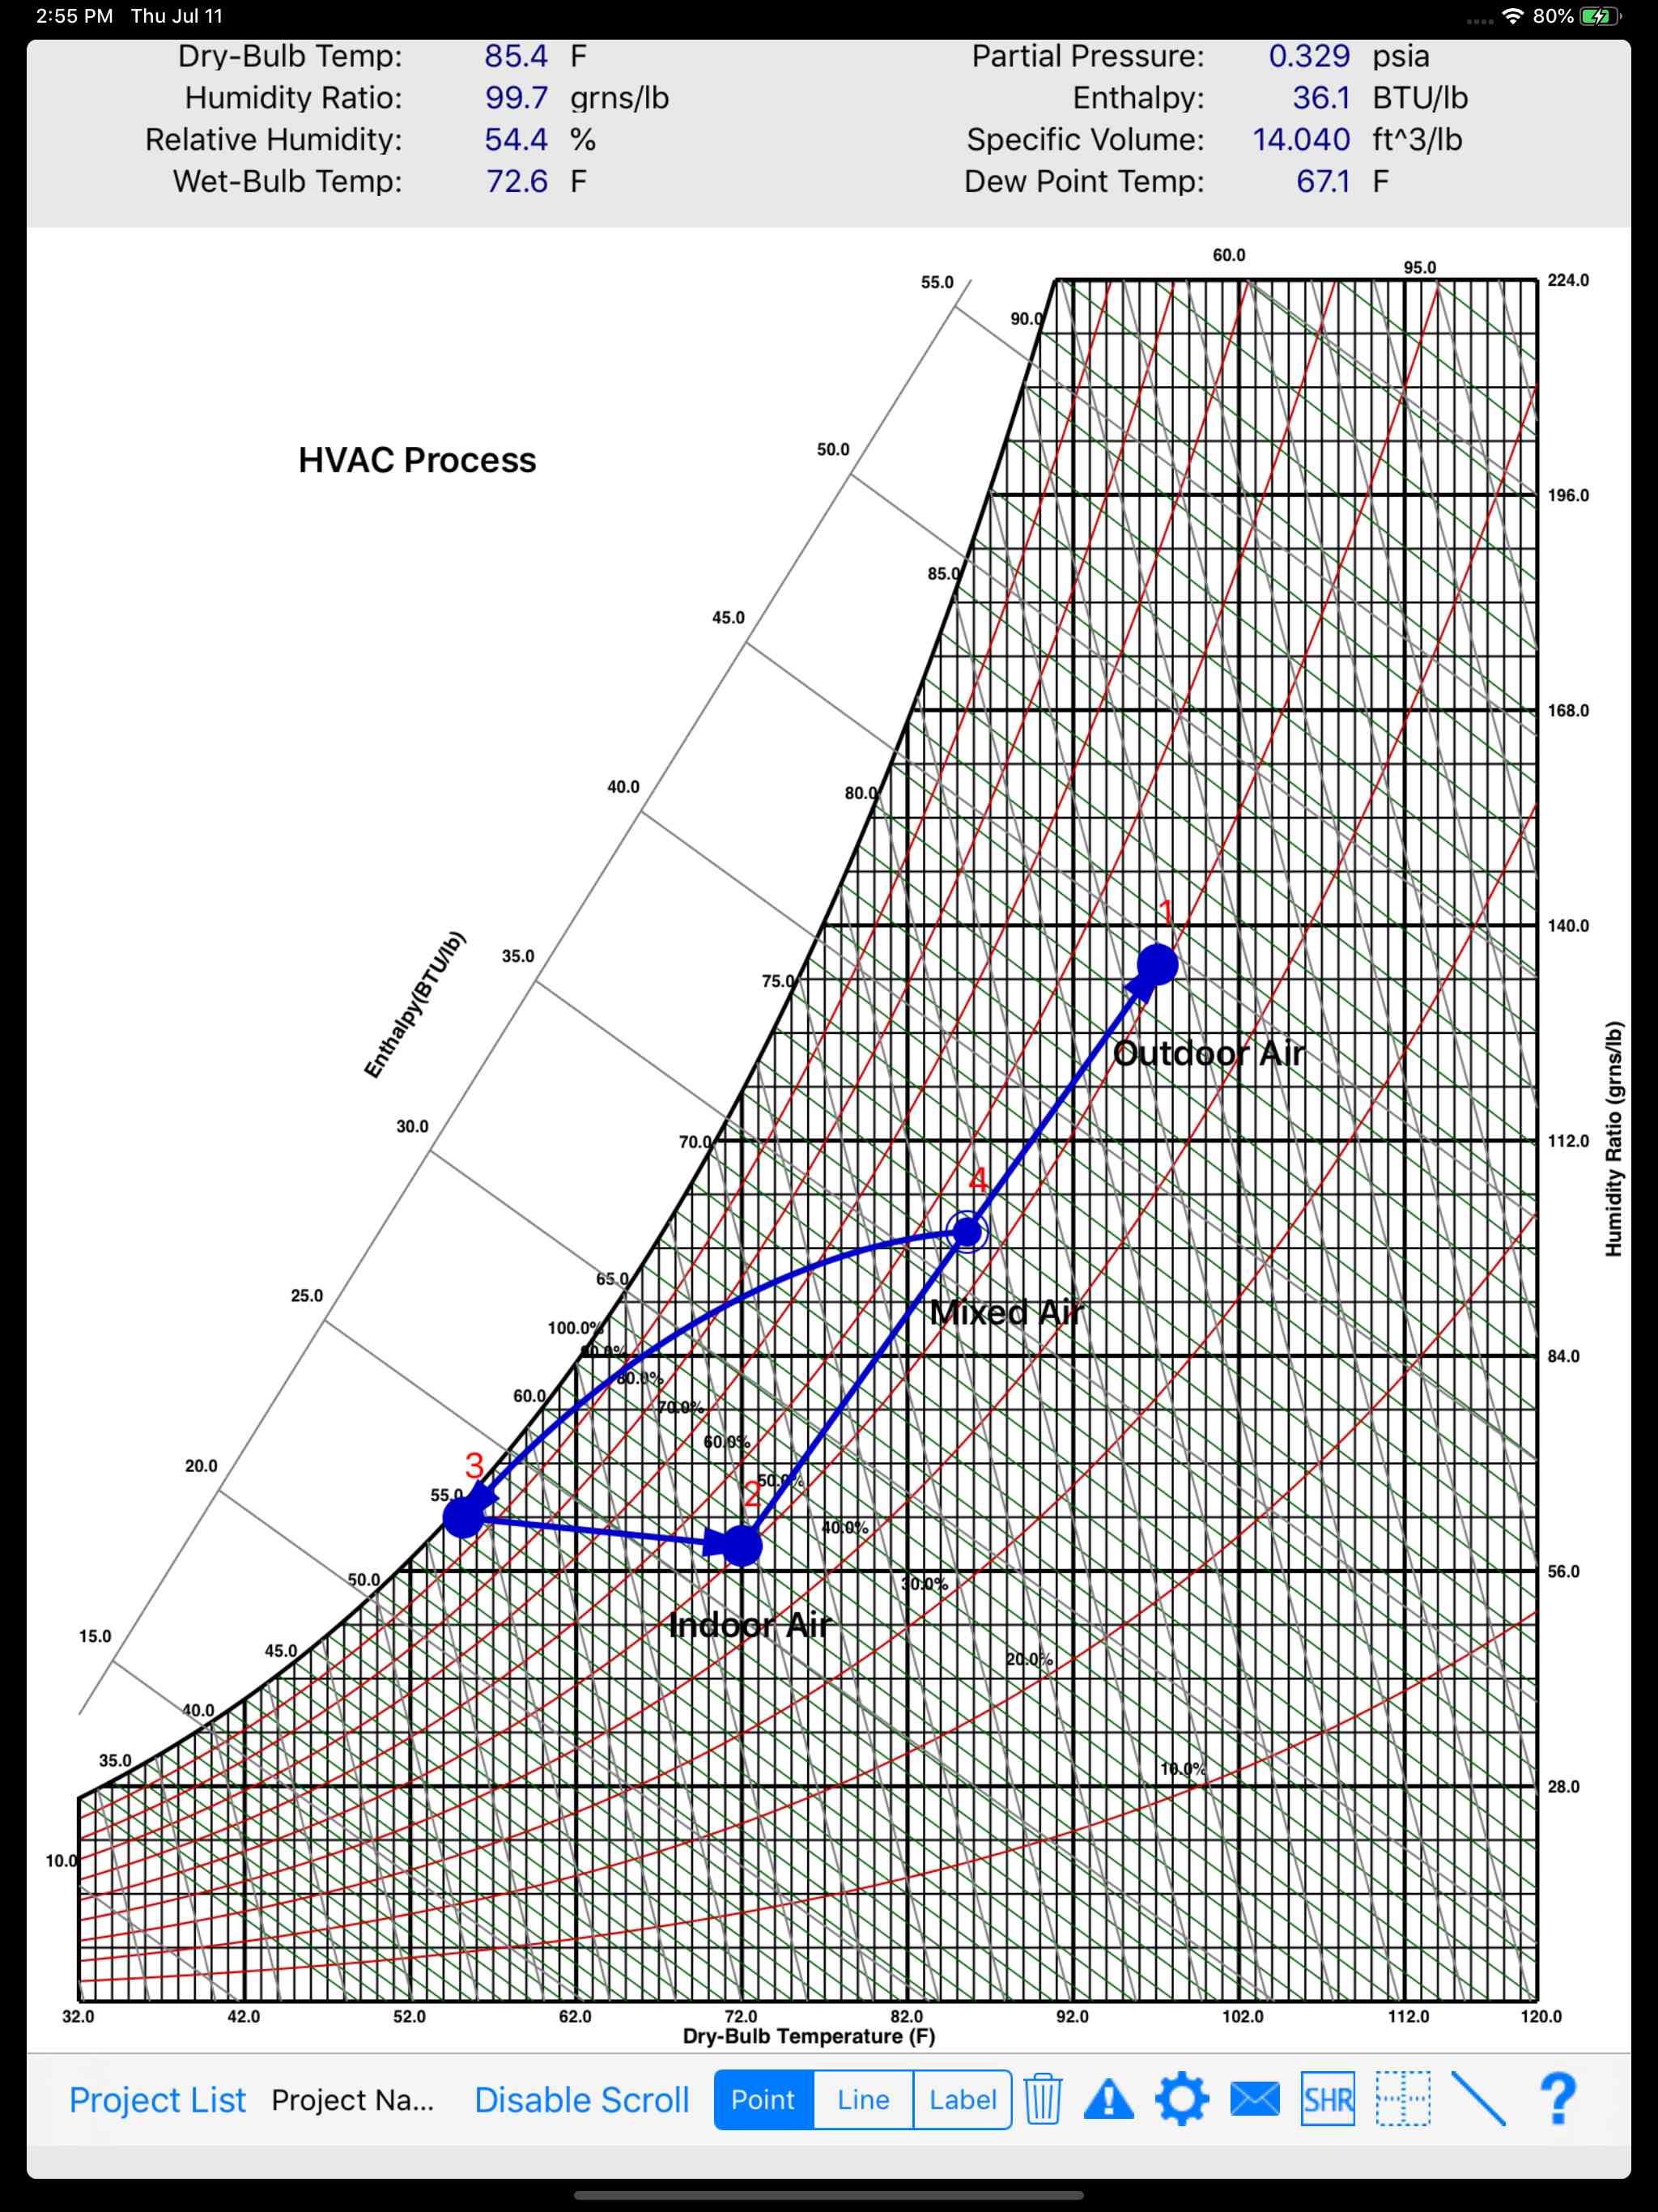
- Create psychrometric processes by plotting points then connecting them with process lines. Also, create custom labels anywhere on the chart
- Display a sensible heat ratio (SHR) line at an angle that represents the required sensible to total heat percentage so you can plot points along it
- After you have completed creating the chart, email a list of all the points and their properties along with a PDF of the chart, itself
- Create an unlimited number of psychrometric chart projects. Also, create templates that you can reuse over and over again
- Display all values in either English (IP) or Metric (SI) units
- Change the altitude in the chart properties form and the chart will automatically adjust to the new barometric pressure (great for cities like Denver, CO)
- Delete individual points or refresh the entire graph
- As you move your finger around the graph, a cross-hair indicator graphically shows you where you are relative to the x- and y-axis.
- Easily copy points while in the Point Properties Form, and then edit those new points
- Enter airflow values for points that are connected to other points and display total, sensible, and latent energy gains/losses.
- While in the Point Properties Form, move the slider control for any one of two inputs and instantly observed updated results along with the new point position
- Toggle the display to show directional arrows of the flow of air from one point to another